
Debraliz Isaac Aragones1,2, Chien-Hua Chen1,∗, Justin A. Weibel2, David M. Warsinger2, Richard W. Bonner1
ABSTRACT
Liquid pumping requires large quantities of electrical energy, including about 7%of the energy of building heating, ventilation, and air conditioning (HVAC) systems. To replace pumped condenser-cooling tower water loops with a passive alternative system, we implemented a commercial-scale two-phase loop thermosyphon (TPLT). The unit consists of a 13 m riser integrated with a commercially available cooling tower and circulation water heater that simulates heat loads up to 25 kW. In addition to providing passive cooling capabilities, the cooling tower unit is also maintenance-free, reliable, and can operate in both dry and wet modes. This study characterizes the performance (temperature difference between the evaporator and condenser) and the two-phase flow behavior of the loop under various refrigerant charges. Sight glasses installed throughout the loop are used to identify the operating flow regimes in the riser and downcomer. Over the range of operating conditions, we identified that there is an optimal refrigerant charge range for a specific heat load at which near-isothermal operation can be achieved. We further developed a model to predict the operating flow rate and gravitational height in the downcomer and compared it with the experimental data. The results show that the model agrees with the experimental data, in particular the threshold gravitational head height at which there will be subcooled liquid at the condenser exit, indicating that it can be used as a predictive tool for identifying the optimal loop charge for a given heat load.
Keywords:
Gravity-driven two-phase loop thermosyphon, pressure drop, refrigerant charge mass.
NOMENCLATURE
Subscripts
𝑓 Liquid
𝑔 Gas
INTRODUCTION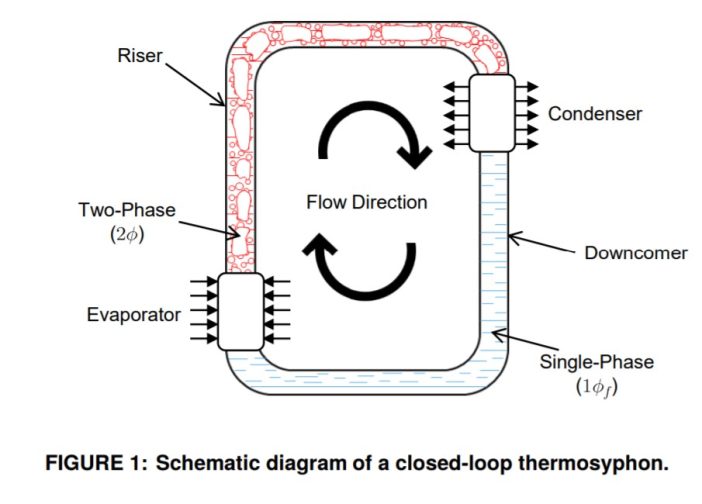
Current heating, ventilation, and air-condition (HVAC) systems typically use open-loop evaporative cooling towers that require a condenser pump. This condenser pump accounts for about 7% of the total power consumption for building HVAC systems [1]. Eliminating the need for this pump would result in significant energy savings potential. This study presents the use of a two-phase loop thermosyphon (TPLT) to deliver high heat loads (up to 25 kW) to a cooling tower over a long height of 13 m without the use of a pump. A TPLT is a natural circulation heat transfer device driven by a fluid density difference and gravity. A schematic diagram of a typical TPLT is shown in Figure 1. A TPLT consists of an evaporator, riser, condenser (placed higher than the evaporator), and downcomer. A heat load is applied to the working fluid in the evaporator and the exiting two-phase mixture (or single-phase vapor) is driven upward by buoyancy forces. The working fluid travels up through the riser and into the condenser where heat is removed. The condensate returns to the evaporator through the downcomer due to gravity. Because a TPLT can ideally operate near- isothermally at the fluid saturation temperature, it has an excellent potential heat transfer capability of offering minimal thermal resistance. Additionally, it has no moving parts, making it more reliable in comparison to pumped cooling systems.
The performance of TPLTs for HVAC applications has been studied theoretically and experimentally at smaller scales. One study investigated the factors affecting the liquid head height in the downcomer as a function of the temperature difference between the evaporator and condenser, as well as refrigerant charge [2]. It was found that the fluid in the downcomer is not always a continuous column of single-phase liquid; increasing the evaporator-condenser temperature difference and the refrigerant charge will raise the liquid head. Another study explored the optimum refrigerant charge to minimize the temperature difference between the evaporator and condenser sections in a microchannel TPLT with respect to evaporator airflow rates and outdoor air conditions [3]. The cooling capacity of a TPLT integrated with a vapor compression cycle has also been studied experimentally [4, 5]. The current study aims to understand the TLPT operational flow regimes corresponding to various refrigerant charges and power inputs, and the correspondence between these regimes and system performance in terms of the evaporator-condenser temperature difference. Using the insight from the experimental evidence, a physics-based two-phase flow model was developed to predict the TPLT operating flow rate and liquid head.
EXPERIMENTAL METHODS
A TPLT system was constructed and implemented with commercial HVAC equipment, with a total height of 13 m. For each test at a fixed refrigerant charge, the power input was first set to 15 kWand then increased in 2.5 kWincrements up to 25 kW. The system used R-134a as the refrigerant at multiple different charge levels from 27 kg (60 lbs) to 49.5 kg (110 lbs) (in 4.5 kg (10 lb) increments); data were collected for each charge.
2.1 Flow Loop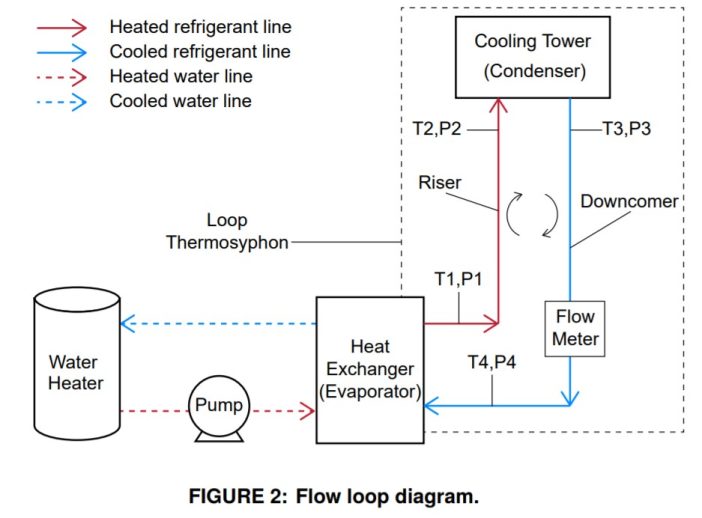
Figure 2 shows a diagram of the system used to perform the experiments. The water heater operates using resistance coils and can be adjusted to deliver the desired power input up to a maximum of 25 kW. The heater is set up to pump the water to a flat plate heat exchanger (SWEP B50H) that serves as the evaporator (Figure 2 bottom left). The evaporator has four ports,
Q = 15 kW 17.5 kW 20 kW 22.5 kW 25 kW
two of which are connected to the water heater and the other two are connected to the TPLT system refrigerant. Both the water and the refrigerant enter through the bottom of the evaporator and exit from the top ports in a co-current fashion. The heated refrigerant becomes less dense and the bubbles formed are driven upward by buoyancy forces to the condenser through the riser.
The condenser used is a commercially available unit (Baltimore Air Coil, VC1-10-DM) with a 24.62 kW cooling capacity. The condenser consists of several parallel serpentine coils where the refrigerant is condensed back to the liquid phase. The condenser can accomplish the heat rejection in a dry mode, without the use of a water spray, or in a wet mode, with the use of a water spray. In this work, the condenser was operated in the wet mode. Gravitational forces return the refrigerant from the condenser to the evaporator through the downcomer. The refrigerant thereby cycles around the TPLT, passively rejecting the total heat load. Temperature and pressure measurements are taken at the inlets and outlets of the riser and downcomer, as labeled in Figure 2.
Sight glasses were also installed every approximately 1 m (3 ft) throughout the loop to allow for the identification of flow regimes.
2.2 Experimental Procedure
To begin each experiment at a set refrigerant charge, the water heater, pump, and condenser are turned on. The water heater is set to the desired power input. The system is given 30-60 min for the temperature and pressure profiles to reach a steady state before increasing the power input. The heat load is then incremented and the process is repeated up to the maximum power input (25 kW).
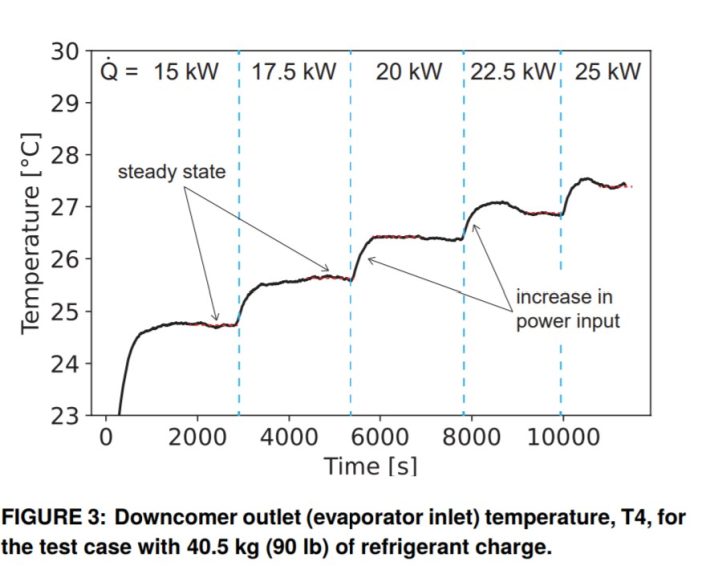
A turbine flowmeter (Omega FTB 1303) measures the volumetric flow rate in the downcomer. A representative example of the temperature measurements at the downcomer outlet (evaporator inlet) for the case with a 40.5 kg (90 lb) charge is shown in Figure3. The sharp increases in temperature correspond to an increase in power input (at the times indicated by the dashed vertical blue lines). For the experimental data analysis, the constant sections of the temperature profile (indicated by horizontal dashed red lines) are averaged over the corresponding time period. This results in a single time-averaged data point for each power input.
MODELING APPROACH
A parametric study was conducted using an engineering equation solver (EES) to investigate the effect of change in charge and heat load on the volumetric flow rate and liquid head height in the TPLT. A one-dimensional steady-state model was constructed using energy, mass, and momentum conservation equations. The heat load into the evaporator was assumed to be equal to the heat removed by the condenser. Under this assumption, the accelerational pressure drop terms cancel out for a complete cycle around the loop. The frictional pressure drop through the system lines was considered, but the pressure drop of the relatively shorter flow lengths through the evaporator and condenser was neglected. Minor frictional losses through the pipe fittings were included.
The mass balance was found using
𝑚̇ = 𝜌.𝑢𝐴 (1)
where 𝑚̇ is the mass flow rate of the loop, 𝜌. is the mixture density, 𝑢 is the flow velocity, and 𝐴 is the cross-sectional area.
The mixture density is found by
𝜌. = 𝜌𝑙 (1 − 𝛼) + 𝛼𝜌𝑔 (2)
where 𝜌𝑙 and 𝜌𝑔 are the density of the fluid in the liquid and gas phase, respectively, and 𝛼 is the void fraction parameter. The energy balance across the evaporator and condenser was found to neglect sensible heating of the fluid.
𝑄= 𝑥𝑚̇ 𝐻𝑓 𝑔 (3)
where ̇ 𝑄 is the power input, 𝑥 is the vapor quality, and 𝐻𝑓 𝑔 is the enthalpy of vaporization of the fluid. The pressure drop of the system is derived from a momentum balance considering effects due to acceleration (A) of the flow (heating or cooling), friction(F), and gravity (G):
(︃𝑑𝑃/𝑑𝑧)︃= −(︃𝑑𝑃/𝑑𝑧)︃𝐹−(︃𝑑𝑃/𝑑𝑧)︃𝐴−(︃𝑑𝑃/𝑑𝑧)︃𝐺 (4)
where,
(︃𝑑𝑃/𝑑𝑧)︃𝐺= 𝜌.𝑔ℎ𝑓 (5)
(︃𝑑𝑃/𝑑𝑧)︃𝐹= 𝑓2𝜙12 𝜌.𝑢2 (6)
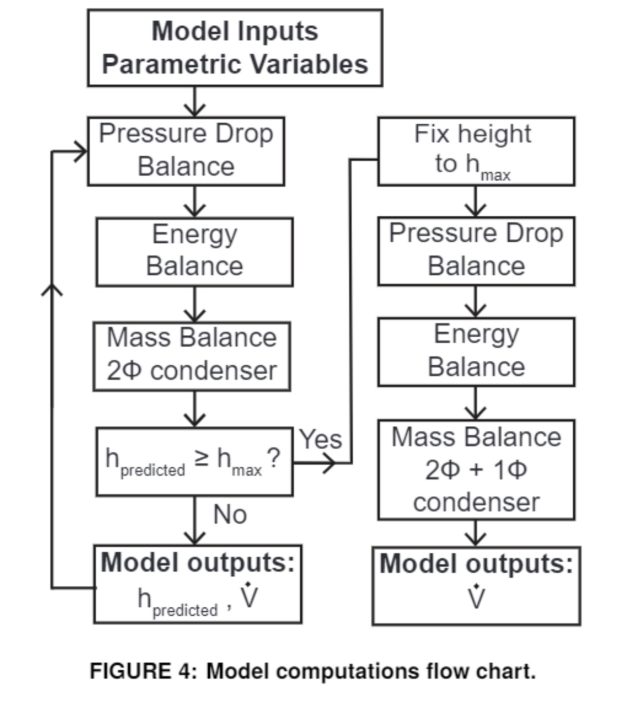 𝑔 is the gravitational constant, ℎ𝑙𝑖𝑞𝑢𝑖𝑑 is the height of the liquid column in the downcomer, and 𝑓2𝜙 is the two-phase friction factor [6]. The Friedel correlation was used for 𝑓2𝜙 based on the recommendations in [7]. A flow chart summarizing the modeling calculations is provided in Figure 4. The user inputs the loop dimensions, fluid properties, and a maximum height constraint boundary condition for the distance between the evaporator and condenser. This condition is crucial to the model to capture the physical limitation of the liquid head height in the downcomer reaching the condenser. Also, inputs are the parametric variables of charge mass and heat load. The model then takes the first set of variables and solves for the riser quality, liquid height, and volumetric flow rate. The mass balance in this calculation only considers two-phase flow in the condenser. If the height constraint has not been reached, the solution is viable and the model proceeds to predict the same output quantities for the next set of variables. However, if the height constraint has been reached for some input conditions, this height is then fixed and the mass balance equation is adjusted to account for liquid backing into the condenser. The model then outputs only the volumetric flow rate and vapor quality (with the liquid head height being at the maximum). The mass balance of the condenser had a significant impact on the results because the condenser accounts for over half of the total volume of the TPLT.
RESULTS AND DISCUSSION
4.1 Sight Glass Observations
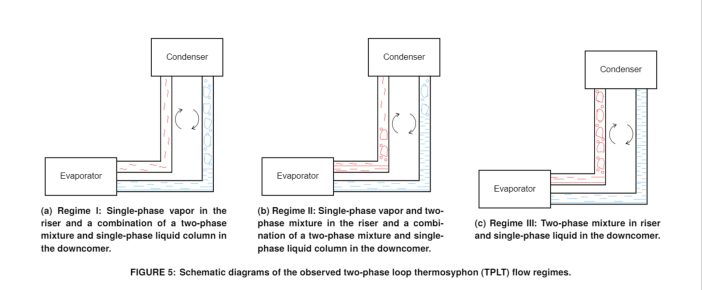
The sight glass observations allowed the identification of three different flow regimes dependent on the refrigerant charge amount and operating conditions. A summary of the observations can be found in Figure 5. A lower charge in the system resulted in single-phase vapor in the riser and a two-phase mixture in the downcomer (Figure 5a, Regime I). The downcomer is suspected to have a very low liquid head height in this regime. Increasing the charge of the system will increase the liquid column height in the downcomer. This ‘transitional’ regime consists of two-phase flow in the riser and both two-phase flow and single-phase liquid flow in the downcomer (Figure 5b, Regime II). When the system is charged such that the liquid head in the downcomer reaches the condenser, there is then a single-phase liquid flow in the downcomer (Figure 5c, Regime III).
4.2 Experimental and Modeling Results
As the target of the TPLT system is isothermal operation, the performance is evaluated using the largest temperature difference in the loop. That is the temperature difference between the evaporator outlet and condenser outlet.
Δ𝑇𝑙𝑜𝑜𝑝 = 𝑇3 − 𝑇1 (7)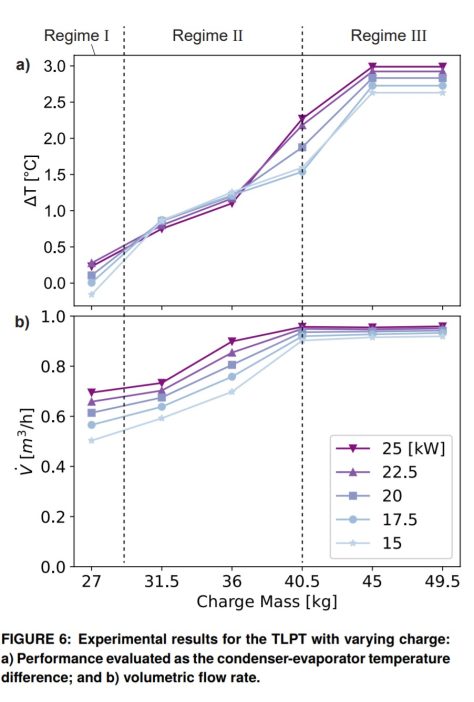
This temperature difference is plotted as a function of the refrigerant charge in Figure 6a for each power input. These results indicate that an increase in charge increases the overall temperature difference across the loop. The pressure difference across the TLPT is used to explain the trends with power input at each of each charge because the loop operates with the refrigerant in a saturated state, where the temperature and pressure are directly related. At 27 kg (60 lb), in Regime I, Δ𝑇 is seen to increase with increasing charge. This is because the gravitational pressure head in the downcomer is low enough that the frictional pressure drop in the riser dominates. When the input power increases, the frictional pressure increases, resulting in larger static pressure differences and therefore larger (saturation) temperature differences. At 31.5 kg (70 lb) and 36 kg (80 lb), in Regime II , the temperature difference decreases slightly with an increase in power input. This is because the gravitational head is more dominant at these charge levels and the riser gravitational head (or liquid column height) decreases as the power input increases. At 40.5 kg (90 lb), there is a transition from Regime II to Regime III, depending on the heat input. For 15 kWand 17.5 kW, the trend matches the behavior in Regime II for 31.5 kg (70 lb) and 36.5 kg (80 lb); however, further increases in power result in subcooling at the condenser outlet and a considerable increase in the temperature difference. Observations using the sight glasses revealed that at high enough charges the liquid column backs into the condenser, characteristic of Regime III as described above. This is identified to be the cause of problematic subcooling at high charges. At 45 kg (100 lb) and 49.5 kg (110 lb), operation in Regime III subcooling across all heat inputs. However, it is interesting to see that, at each given heat input, the temperature differences do not become more severe from 45 kg (100 lb) to 49.5 kg (110 lb). This could be explained by the fact that the condenser has a large manifold and the additional 4.5 kg (10 lb) of charge is most likely floods the manifold first, therefore causing a negligible amount of additional subcooling. It is speculated that if the charge were to continue to increase further, there would be additional subcooling as the condenser manifold filled up and the liquid started to go into the condensing tubing. The measured volumetric flow rate for each test case can be seen in Figure 6b. For each charge, the flow rate expected increases with an increase in power input. For the highest charges of 36-49.5 kg (90-110 lb), operating in Regime III, the flow rates all collapse. This is attributed to the driving liquid head reaching the limit of the condenser height.
Overall, while the best performance occurs at lower charges, having some amount of excess charge does not have a severe negative impact on the system performance for the range investigated.
At 27 kg (60 lbs) the TPLT achieved a Δ𝑇 of less than 0.5◦𝐶 with corresponding flow rates of less than 0.75 𝑚3/ℎ (12.5 LPM). This is quite an improvement compared to conventional open-loop cooling towers which typically have a Δ𝑇 of 5◦𝐶 with a pumped water flow rate of approximately 0.66 𝑚3/ℎ (11 LPM)[8].
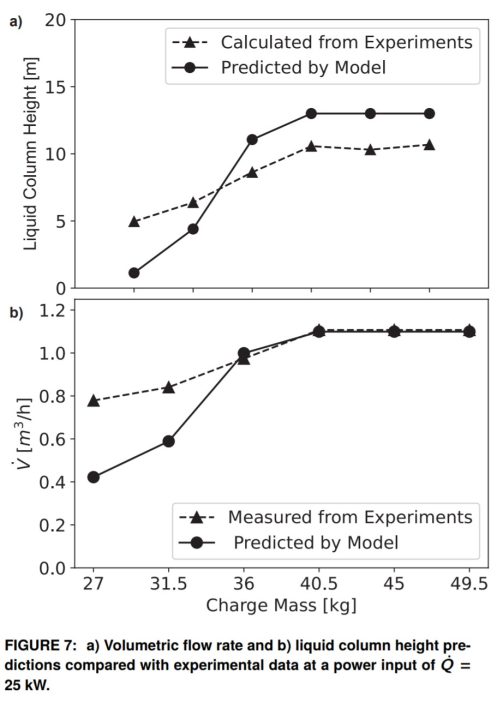
Regarding the model predictions, the liquid column height in the downcomer is calculated using the pressure and volumetric flow rate from the experiments (Figure 7a). The model is able to capture the overall trend of an increasing column height with charge till Regime III. The calculations of the liquid column height are expected to have a mismatch in the quantitative values because the mass flow rate is calculated using a single-phase liquid density, but there is a two-phase flow in the downcomer.
The modeling prediction of the flow rate compared with the experimental measurements is presented in Figure 7b. The model is able to predict the flow rate very accurately at charges of 36 kg (80 lb) and greater where the downcomer is a single-phase liquid. However, there is some discrepancy at lower charges. This is thought to be because the fluid in the downcomer is two-phase at the lower charges. The model calculates the volumetric flow rate in the downcomer using the liquid density rather than a mixture density and therefore underpredicts the flow rate.
CONCLUSION
An experimental and modeling analysis of a large-scale two-phase loop thermosyphon (TPLT) with a 13 m tall riser was conducted. The system was tested at seven different charges of R134a (27 kg (60 lb) to 49.5 kg (110 lb), in 4.5 kg (10 lb) increments) for five power inputs (15 kW to 25 kW, in 2.5 kW increments). Sight glasses installed throughout the loop enabled the identification of three operating flow regimes under various operating conditions. Regime I occurs at lower charges and results in single-phase vapor in the riser and a combination of a two-phase mixture and a single-phase liquid column in the downcomer. This regime resulted in the best performance with an evaporator condenser.
Δ𝑇 < 0.5◦𝐶. Increasing the refrigerant charge results in single-phase vapor and a two-phase mixture in the riser and increases the liquid column height in the downcomer (Regime II). Continuing to increase the charge results in the liquid column backing into the condenser and causes undesirable subcooling in the condenser (Regime III). The results show that the modeling predictions agree with the regime-specific trends in the experimental data for the system flow rate and liquid head height.
ACKNOWLEDGMENTS
This work is supported by DOE NETL under the contract DE-FE0031657. The authors thank Mr. Chad Burkholder, Mr. DennisWinters, and Mr. Phil Martin at Advanced Cooling Technologies, Inc. for their assistance in performing the experiments.
REFERENCES
[1] Morrison, Frank. “Saving water with cooling towers.” ASHRAE Journal Vol. 57 No. 8 (2015): pp. 20–33.
[2] Zhang, Penglei, Wang, Baolong, Shi, Wenxing, and Li, Xianting. “Experimental investigation on two-phase thermosyphon loop with partially liquid-filled downcomer.”
Applied Energy Vol. 160 (2015): pp. 10–17. DOI 10.1016/j.apenergy.2015.09.033.
[3] Ling, Li, Zhang, Quan, Yu, Yuebin, Liao, Shuguang, and Sha, Zhengyong. “Experimental study on the thermal characteristics of microchannel separate heat pipe respect to different filling ratio.” Applied Thermal Engineering Vol. 102 (2016): pp. 375–382. DOI 10.1016/j.applthermaleng.2016.03.016.
[4] Han, Linjun, Shi, Wenxing, Wang, Baolong, Zhang, Penglei, and Li, Xianting. “Development of an integrated air conditioner with thermosyphon and the application in mobile phone base station.” International Journal of Re- frigeration Vol. 36 No. 1 (2013): pp. 58–69. DOI 10.1016/j.ijrefrig.2012.09.012.
[5] Lee, Sunil, Kang, Hoon and Kim, Yongchan. “Performance optimization of a hybrid cooler combining vapor compression and natural circulation cycles.” International Journal of Refrigeration Vol. 32 No. 5 (2009): pp. 800–808. DOI 10.1016/j.ijrefrig.2008.12.008.
[6] Ghajar, Afshin J. and Bhagwat, Swanand M. Frontiers and Progress in Multiphase Flow I (2014). DOI 10.1007/978-3- 319-04358-6.
[7] Thome, John R. “Engineering Data Book III Two-Phase Pressure Drops.” (2006): pp. 13.1–13.34.
[8] “Water Piping and Pumps Technical Development Program.” Technical report no. Sigler Commercial. 2017. URL http://siglercommercial.com/wp-content/ uploads/2017/10/02-Chilled-Water-Piping-Pumps.pdf.